Economic growth and income levels determine purchasing power and food choices, often leading to shifts from staple local foods to diets influenced by lifestyle and food environments variedly in urban and rural areas. Economic development is also reflected in the industrialisation of agriculture, structural shifts in the value chain, public and private investments, access to market infrastructure, market connectivity of marginal farmers, and profit-driven food monocultures. Economic growth indicators are being monitored under SDG 8 which is about promoting inclusive and sustainable economic growth, employment and decent work for all. The projections on the SDG 8 indicators are scarcely available due to the high uncertainties embedded in the economic systems.
This section presents selected data on key trends within economic development:
- GDP Growth and Regional Disparities
- Food Prices and Inflation
- Corporate Practices, Power and Influence
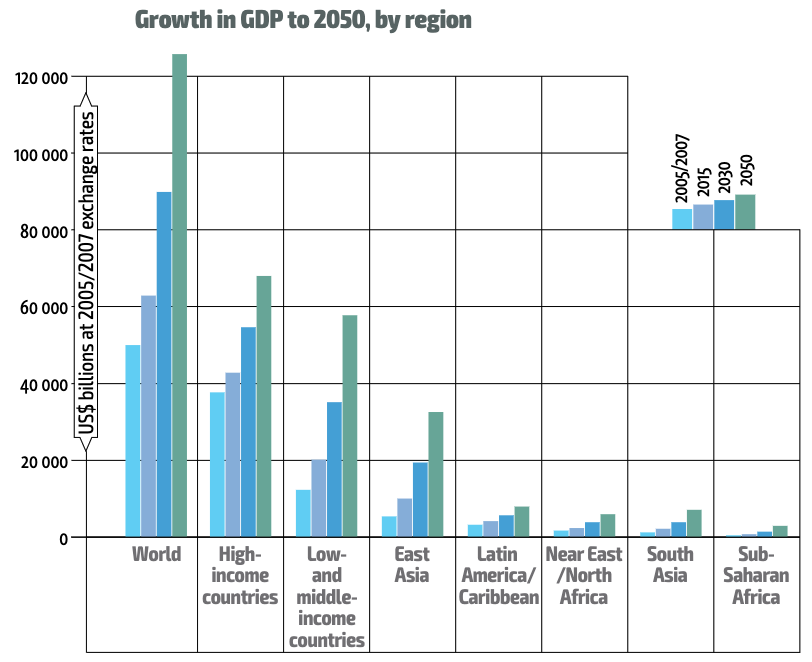
1. GDP Growth and Regional Disparities
Current trends and projections
The world economy grew by 2.6 per cent a year to almost double in size between 1990 and 2014. During that period, global economic growth was driven mainly by low- and middle-income countries, whose gross domestic product (GDP) grew by some 5.1 per cent annually. China’s GDP grew at double that rate, by more than 10 percent a year, and in 2014 the country accounted for 9 percent of global GDP, compared to just 2 percent in 1990. Per capita income in emerging East Asia and the Pacific increased by 7.4 per cent annually between 1990 and 2014; in contrast, average income growth in sub-Saharan Africa stood at a meagre 1.1 per cent a year, a reflection of starkly diverging growth patterns among low- and middle-income regions. Economic growth projections in terms of GDP under different scenarios are provided in (FAO 2017). According to the report, despite the higher annual GDP growth rate in low- and middle-income countries by 2050, the average incomes of the population of low- and middle-income countries would remain only a fraction of those of people living in high-income countries, rising from 8.5 per cent in 2005–7 to 16 per cent in 2050. Furthermore, given the large difference in initial levels of per capita GDP, the income gap would continue to widen in absolute terms, from US$ 25,500 to almost US$ 40,000.
Implications
The growth disparities are a contribution of disparities in investment, labour productivity and vulnerabilities to crises like COVID-19. These national growth disparities transcend to income inequalities which affect people’s ability to afford education, health care, and nutritious food and induce other forms of inequalities. In the coming decades, extreme income disparity and poverty is projected to become increasingly concentrated in regions where the population continues to grow rapidly like Sub-Saharan Africa and South Asia. This disparity will affect the food security of persons living in vulnerable situations the most (FAO 2017).
2. Food Prices and Inflation
Food price volatility in the last 50 years reached its highest level during the 1970s and volatility is recorded in recent years. The real food price index (RFPI) shows a steady decline between 2010 and right before the Covid pandemic. There was a drastic spike in the RFPI in 2020-21 which stabilised in 2022-23. In recent years, there has been an increase in the price indices for vegetable oils, dairy products and sugar which was counterbalanced by decreases in those of cereals and meat. In Nov 2023, the index stood 14.4 points (10.7 per cent) below its corresponding level one year ago. Future food price projections are uncertain due to various assumptions regarding technological changes, policies, yields, market modifications, and conflicts like the Ukraine war (FAO, 2022).
Trends
Food price volatility in the last 50 years reached its highest level during the 1970s and volatility is recorded in recent years. The real food price index (RFPI) shows steady decline between the 2010 and right before the Covid pandemic. There was drastic spike in the RFPI in 2020-21 which stabilised in 2022-23. In the recent years, there has been increase in the price indices for vegetable oils, dairy products and sugar which was counterbalanced by decreases in those of cereals and meat. In Nov 2023, the index stood 14.4 points (10.7 percent) below its corresponding level one year ago. Future food price projections are uncertain due to various assumptions regarding technological changes, policies, yields, market modifications, and conflicts like the Ukraine war (FAO, 2022).
Implications
Unprecedented global events like pandemics and the 2007-8 economic crisis leading to food price fluctuations around the world increased the volatility and uncertainty of future food prices (FAO, 2017). Food price inflation remains a critical issue, exacerbating food insecurity and poverty, particularly in developing countries. An estimated 238 million people experienced acute food insecurity in 2023, an increase of 21.6 million from the previous year (United Nations, 2024). Global Panel (2020) report links food prices with nutrition intake. According to the report, there is a significant price gap between foods recommended for healthy diets and cheaper, less nutritious options, with animal-source foods being the most expensive globally, followed by fruits, pulses, and vegetables, while staples and sugar will be less costly in 2030 (Figure).
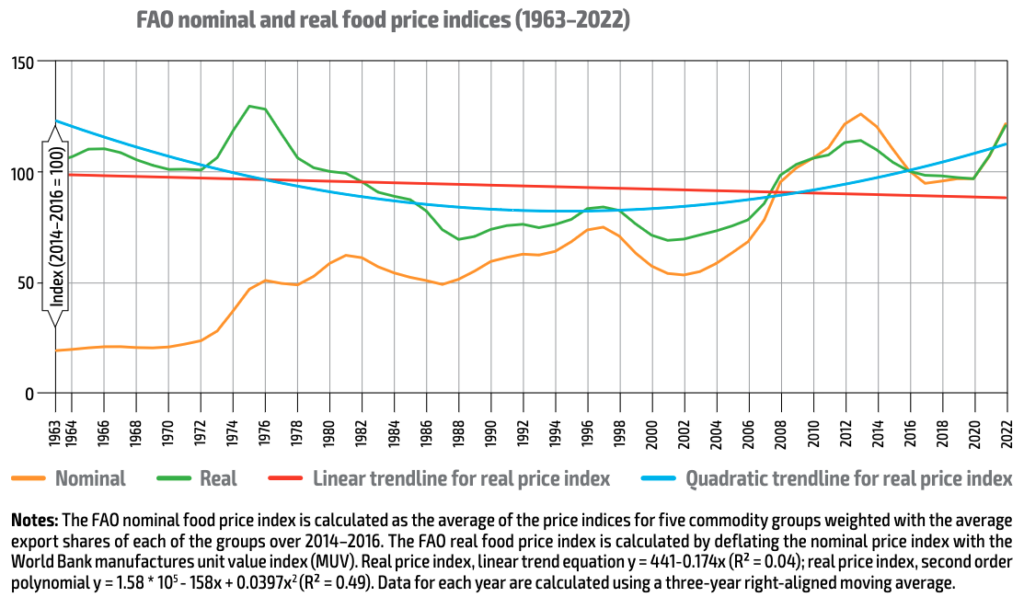
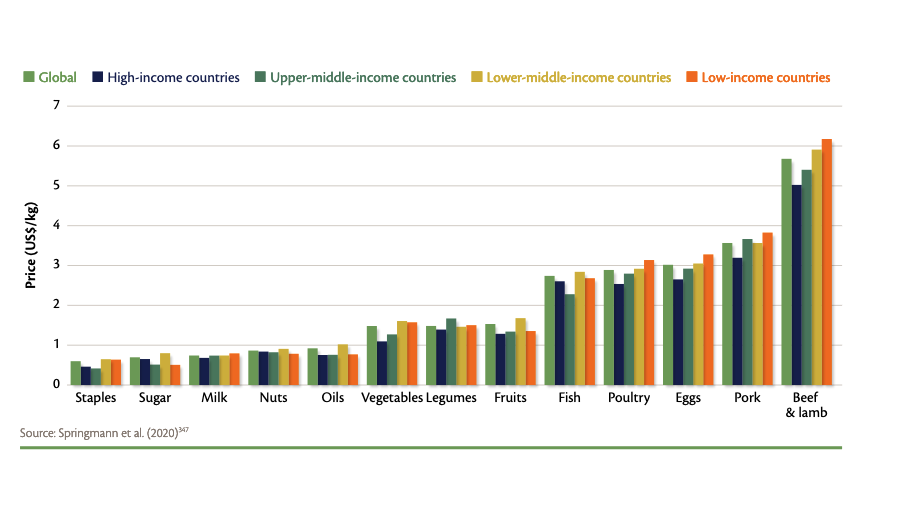
Figure 1: Nominal and real food price indices (1963–2022) Source: FAO, 2022 | Figure 2: Projected food commodity prices in 2030 by income region Source: Global Panel, 2020
3. Corporate Practices, Power and Influence
Trends
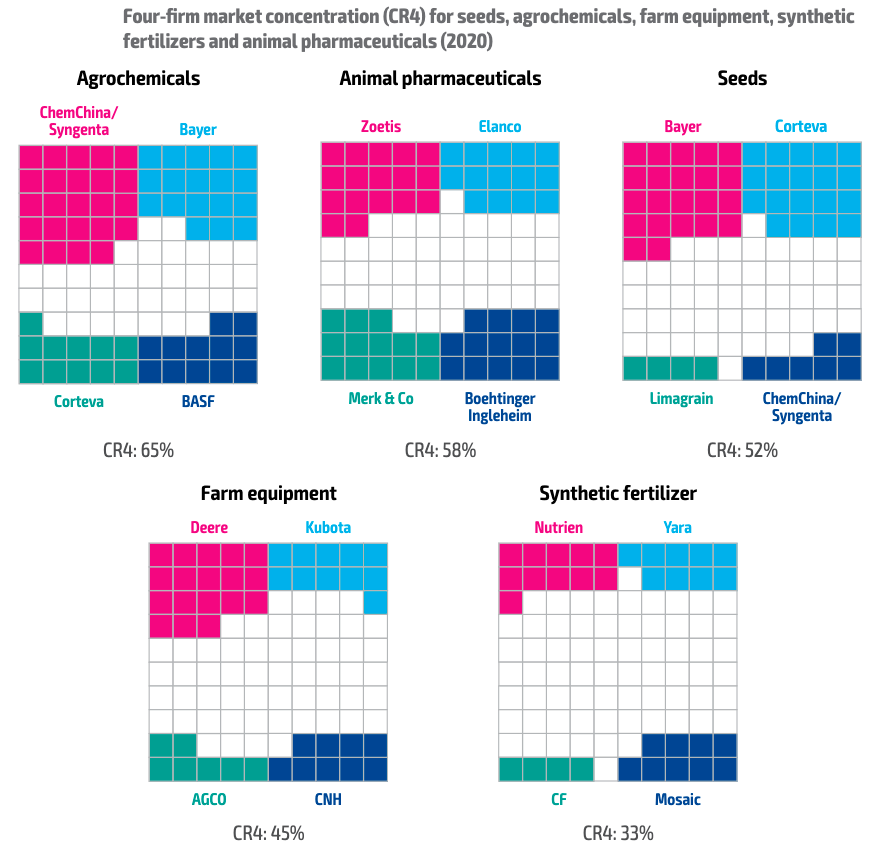
The market concentration is evident in the agri-input sector. In recent years, major mergers and acquisitions in the agrochemicals and seed sectors have occurred. However, FAO experts speculate that due to the development of widely accessible technologies like gene-editing technology, the cost of developing crop varieties could be reduced, enabling new and smaller companies (including start-ups) to grow (FAO, 2022). The food traders and retailers are also massively consolidating, with 80% of products in grocery stores sold by 4 big food companies (Noble Origins, 2024).
Implications
The structural changes in the food supply chain and the increasing influence of food corporates on food markets is changing the distribution of power among actors in the food value chain. The concentration of agro-food activities within a limited number of corporate giants is an example of this structural change. This influences pricing, bargaining power, data ownership, access to resources and diets. Monopolies in the food value chain can result in the exploitation of farmers, inequitable distribution of profits, and challenges in achieving sustainability and resilience.
Please email info@foresight4food.net if we are missing any data updates.