Climate change, resource availability, and environmental sustainability impact agricultural practices, food production, and supply chain resilience. The degrading status of land, competition for water and fuel, bio-fuel race, forest encroachments, food waste and food safety pose inevitable pressures on the food system.
This section presents selected data on key trends in climate and environment:
- Climate Change
- Land Degradation
- Food Loss and Food Safety
1. Climate Change
Projections
A study cited in FAO reports analysed results from various integrated climate and crop models (primarily wheat, maize, rice and soybeans) and indicated that climate change may significantly reduce yields in the long run. The most severe economic and food system impacts on crop yields and fisheries will be borne disproportionately by low-income countries (FAO, 2022).
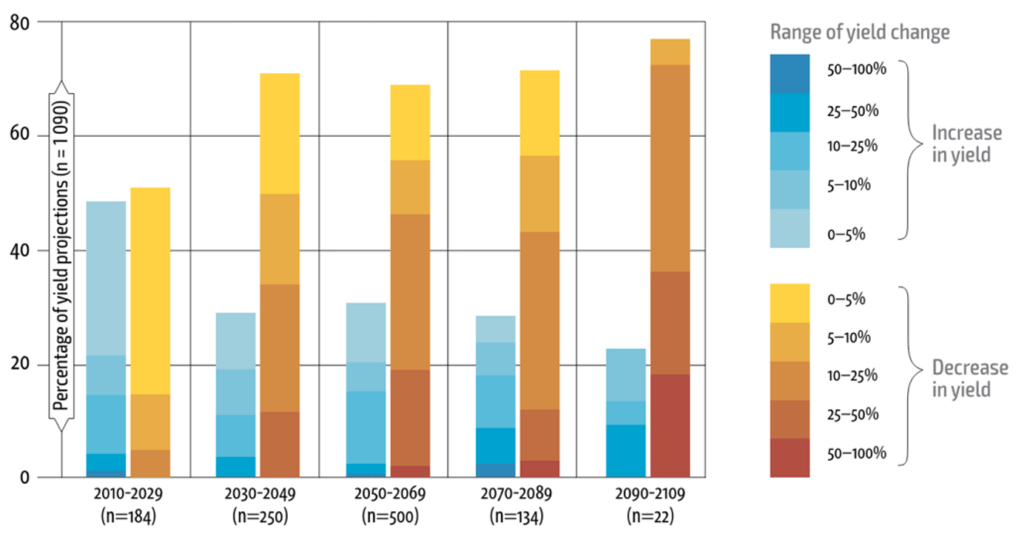
The pervasive effects of climate change on agricultural productivity, resource availability, and extreme weather events pose significant challenges to food security and necessitate adaptive strategies within the food system. This is also one of the biggest uncertainties. According to IPCC, there are catastrophic effects of climate change on the food security due to impacts on crop, livestock, forestry, fishery (inland and ocean) and the key biological events which supports food systems especially in Asia, Africa and South and Central America where communities heavily depend on natural ecosystems for food security (IPCC, 2022) with significant impacts on agricultural revenues in Argentina, Mexico, and Brazil (FAO, 2022).
Although the uncertainty is high, the use of climate models in conjunction with crop models is contributing valuable insights into the possible impacts of climate change on yields.
2. Land Degradation
Trends and Projections
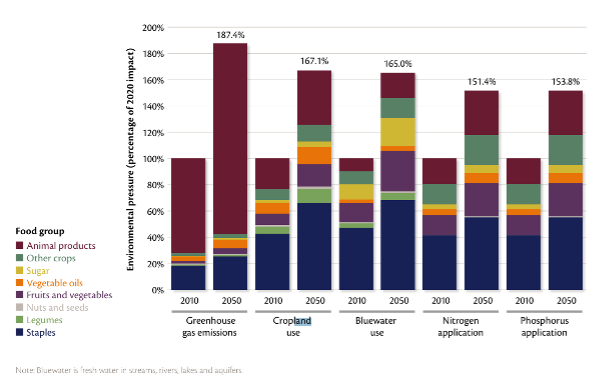
The highest levels of land degradation are manifest in the lowest-income countries (Global Panel, 2020). Commercial agriculture is the most important driver of deforestation in Latin America, accounting for around two-thirds of total deforested area. In Africa and tropical and sub-tropical Asia, subsistence agriculture accounts for a larger share of deforestation than commercial agriculture. Between 2000-2010, low-income countries experienced both the largest annual net loss of forest area and annual net gain in agricultural area (FAO, 2017). With the continued trends in food production and consumption the cropland use is projected to increase from 12.6 M km2 in 2010 to 21.1 M km2 in 2050 i.e. 67% (EAT-Lancet, 2019) with associated loss in biodiversity. The figure below shows the environmental footprints of different food groups (also showing land use increase by 67% by 2050) (Global Panel, 2020).
Implications
Land degradation, deforestation and water scarcities are among the most visible manifestations of the unsustainable competition. Paradoxically, some efforts aimed at reducing greenhouse gases (GHGs) emissions have led to further intensification of competition for land and water resources (e.g. in countries intensively producing biofuel) (FAO, 2017). Expansion and concentration of agriculture (including raging, grazing and cropping) continues to be the main driver of land degradation. Agriculture is estimated to be the proximate driver for around 80 percent of deforestation worldwide.
3. Food Loss and Food Safety
Trends
An estimated 931 million tonnes of food, or 17 percent of total food available to consumers in 2019, went into the waste bins of households, retailers, restaurants and other food services, according to United Nations research. An estimated one-third of the food produced in the world for human consumption is lost or wasted during the production to consumption stages (FAO, 2022). In African countries, the food loss occurred at the post-harvest stage is the highest and account for more than 20% of food originally intended for consumption. While it’s difficult to extrapolate these trends as the food loss data is complex and scattered, the historical trends show that post-harvest food loss in many regions including Latin America, South-East Asia and North-Africa has increased significantly (Figure).
Implications
Emerging food safety risks from climate change include those posed by toxigenic fungi, plant- and marine-based bacterial pathogens, Harmful Algal Bloom (HAB) and increased use of chemicals (plant protection products, veterinary drugs) potentially leaving residues in food. Climate change poses risks across the entire food system, particularly in post-harvest storage, distribution, and processing. Higher temperatures increase storage costs and decrease the quality of fresh products like meat, fish, fruits, and vegetables. For example, a temperature increases from 17°C to 25°C raises cold storage energy consumption by 11%.
Warmer and more humid conditions also lead to higher food losses from pests and microorganisms, with insect damage rising due to faster reproductive rates and altered pheromone effectiveness. For example, in Michigan, climate change could reduce the cold storage period for potatoes by up to 35 days by the late century, necessitating more refrigeration. Processing quality, particularly for rice, is also affected by rising temperatures, with increased chalky grains observed in the U.S. and East Asia. Overall, these changes will lower product quality, reduce producer incomes, and raise consumer prices (IPCC, 2022).
Important data sources
The detailed data on current and future risks of climate change on crops and farming is summarised in IPCC report. FAO Food Loss and Waste Database tracks the global progress on SDG 12.3 indicators i.e. Food loss percentage in each stage of the food value chain. The trends are also reported in the latest UN Food Waste Index Report.
Please email info@foresight4food.net if we are missing any data updates.